Using Oral Reading Records Reports as an Administrator
All Administrator-level reports are displayed by selecting the School or District button at the top. Only District Administrators see the District button and have access to District-level reports. If you're looking for a particular section of Reports in Digital Oral Reading Records Reports, use the links below to quickly move to that section:

|
Administrators can download ORR Reports data from the Downloads page. |
View Summary Reports
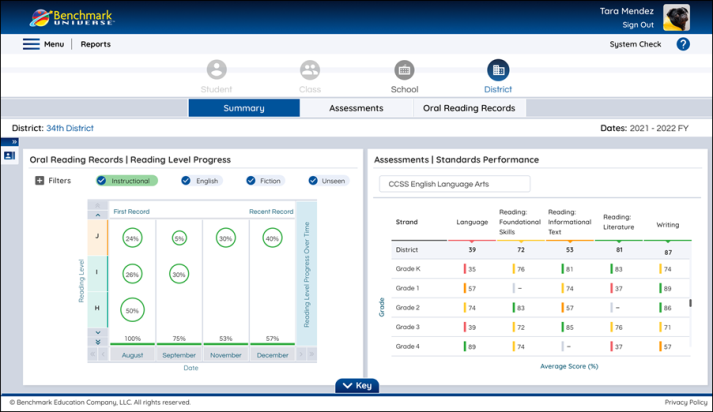
Administrators will see a slimmed down version of the Reading Level Progress report of their district or school soon as they enter Digital ORR Reports. They can select which data they want to view by using the Universal Selector to the left.
Reading Level Progress
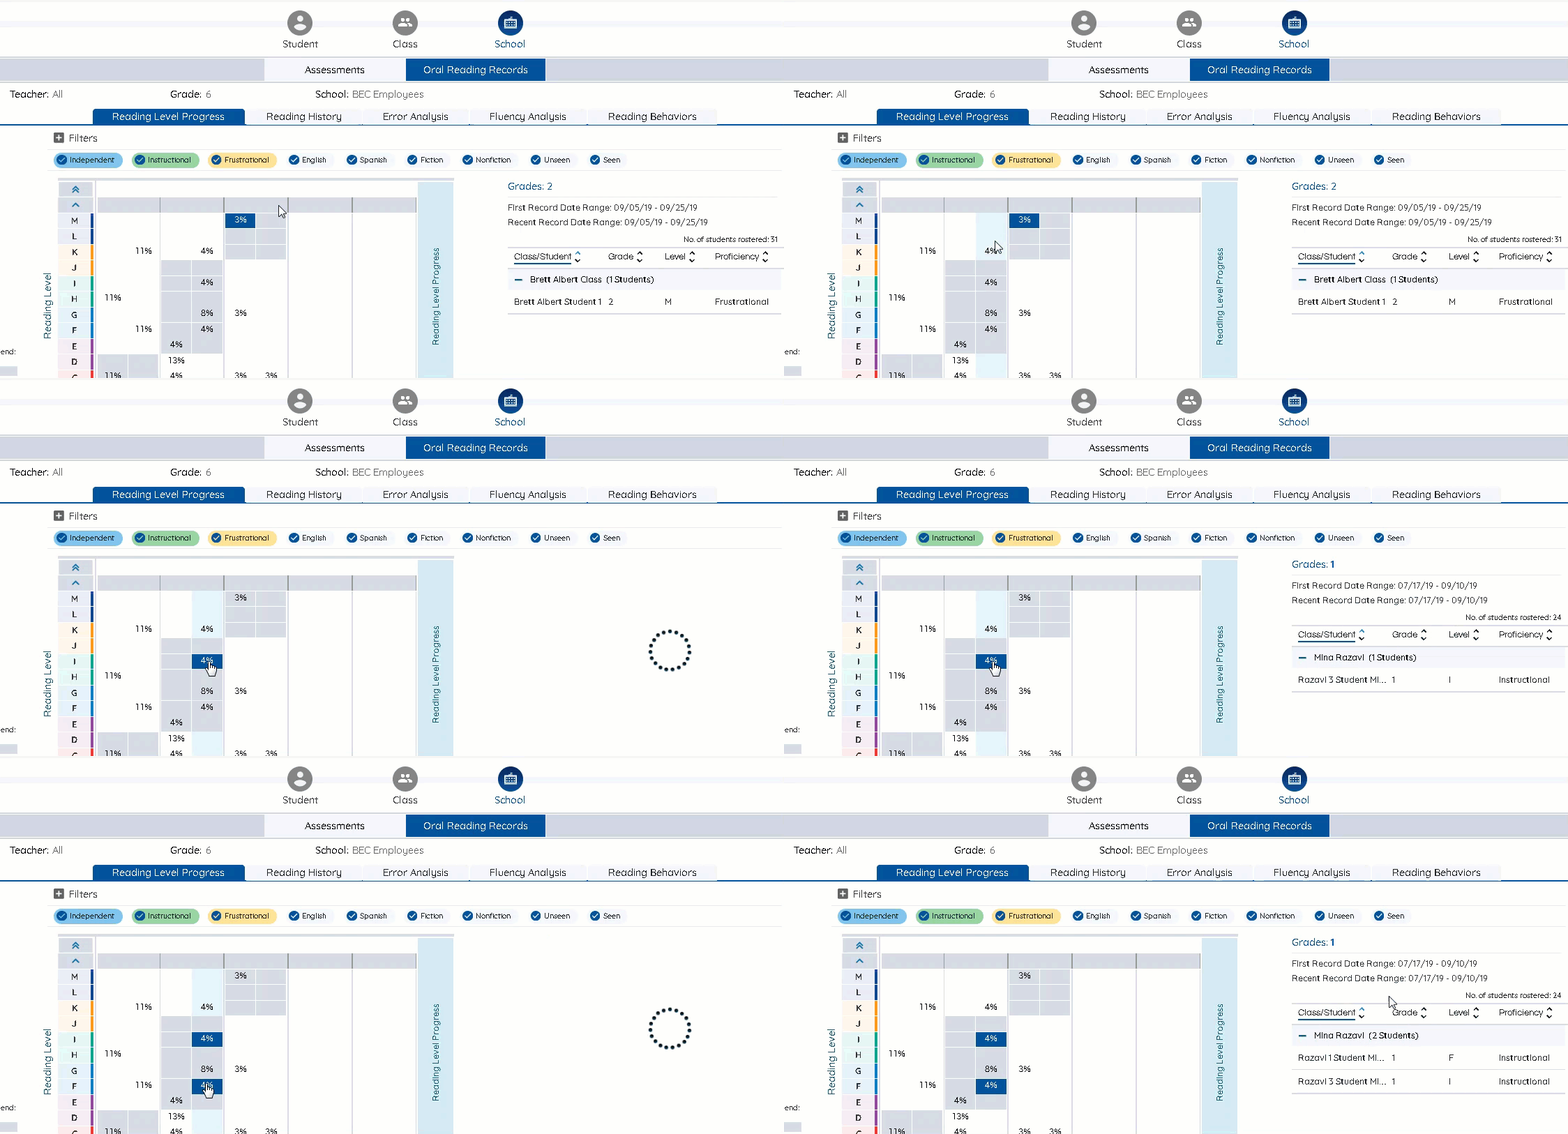
The report displays reading performance across your school or district by grade. Each cell represents the percentage of your rostered students in a grade who have scored at a reading level on their reading records. These scores come from students’ first taken record and their most recent taken record.
- The rows on the Y Axis correspond to Reading Level.
- The columns on the X Axis shows which grade’s data is being displayed. Each grade has its own column. Each grade column is split into two columns, a First Record (left column) and Last Record (right column).
- First Record is calculated using the very first record each student has taken. First Record provides you a starting point for how the school or district is improving from the start of the year to the end. Keep in mind, these aren’t necessarily in the same month, depending on when students in different classes are delivered their assessments. If a student has only taken one record, that record is accounted for in this column.
- Recent Record is calculated using the most recent record a student has taken. Recent Record gives you an understanding of how the school or district is currently doing. Remember, each student’s Recent Record may have occurred at different times, depending on when students in different classes are delivered their assessments.
-
A cell’s location on the report shows the percentage of students in that grade who scored within that Reading Level.
-
You may select multiple cells in a particular Grade column to see which students’ assignments are included in those cells in the student table to the right.
-
The School Admin table groups all of the students by class, displayed by expandable rows that show the class name and how many students from that class are included in the selected cells. The District Admin table groups data by class.
-
The top of the table lists the grades represented in the cells you’ve selected.
-
Select the row to expand the Class, and you’ll see the student name, student grade, the level, and the student’s proficiency score. Select the row again to collapse the class.
-
When there’s multiple classes, you can sort by “Class/Student”.
-
-
By default, no cells are selected. You can select cells within First Record or Recent Record across multiple grades.
-
Use the blue navigation arrows on the bottom corners of the Reading Level Progress chart to view data for assignments taken on other dates. The single arrow will show you other assignments by changing the columns one at a time. The double arrow will skip all the way to the first or last column.
-
You’ll notice some cells highlighted in gray. These highlighted cells show expectations for achieved reading levels for each grade. Each gray cell lines up with a particular Reading Level. This gives you an idea of how many students in a grade are performing above or below their grade level on Oral Reading Records. For more information about Reading Levels, visit Understanding the References Page.
-
In order to see all of the classes (for School Admins) or schools (for District Admins) within a particular grade, select one of the grade labels at the bottom of each Column (for instance, K or 1).
-
This will show you the same view as before, but with performance according to each Class or School within that grade. Each has its own column.
-
The top of the table lists the Classes or Schools represented in the cells you’ve selected.
-
To return to the All Grades view, select Back to All Grades in the top left of the chart.
-
Reading History Overview
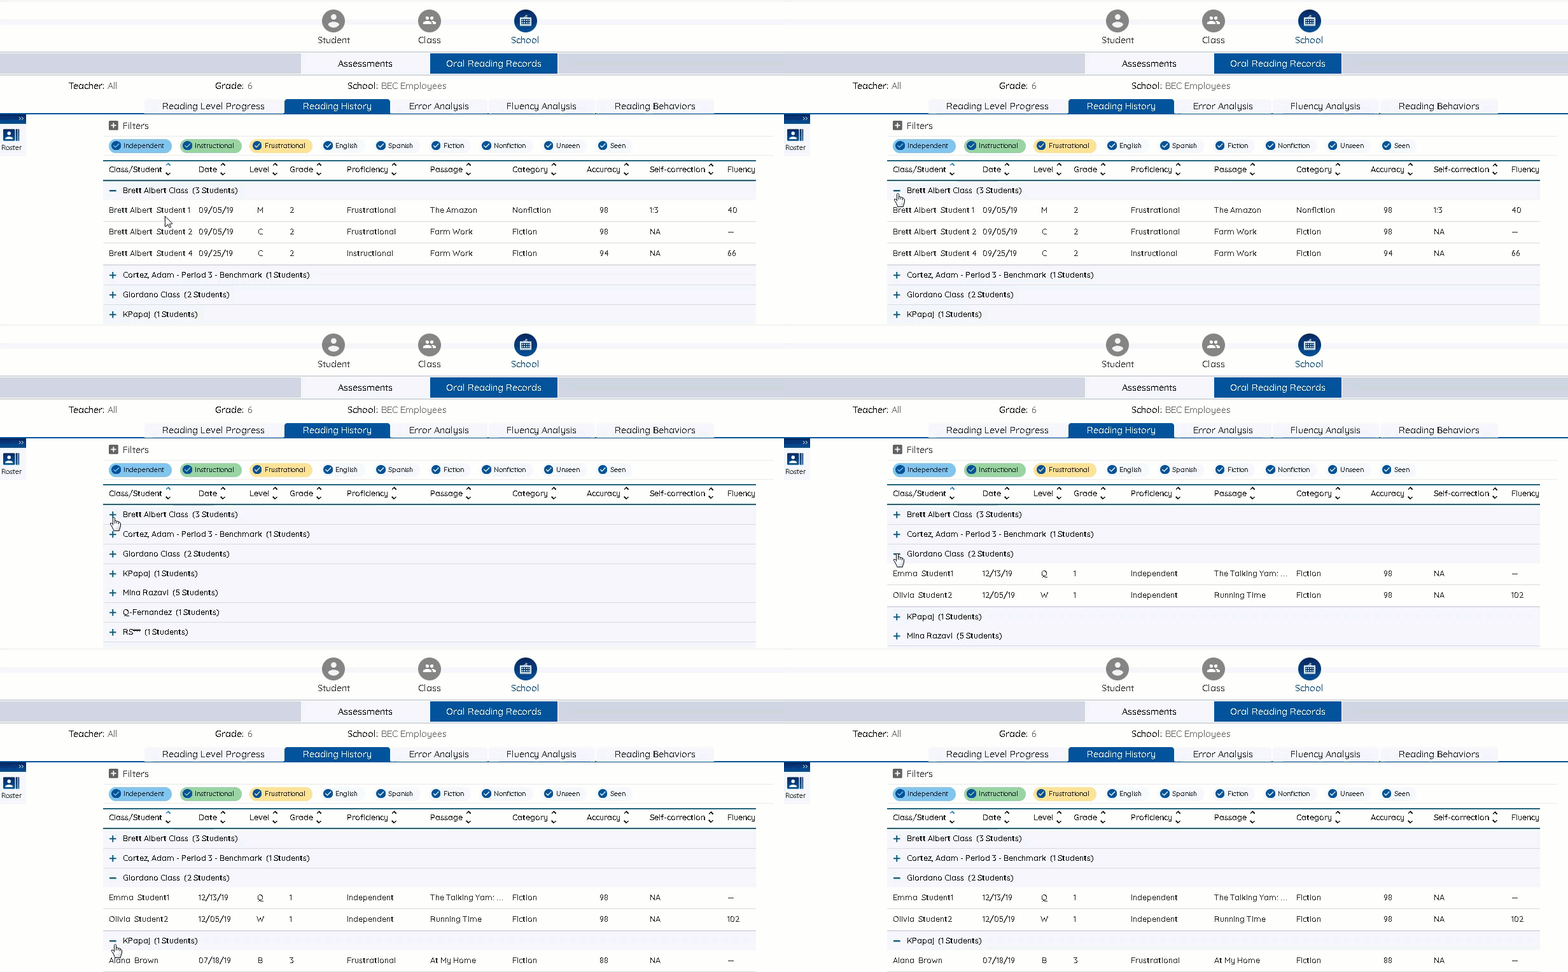
View a summary of all the Digital Oral Reading Records taken in a School or District with the Reading History Overview. Each row represents a single expandable Class. For District Admins, classes are nested within expandable schools. By default, the list is sorted with the class with the most recent records at the top.
This report is very similar to the Class Reading History Overview report, with only some slight differences:
- The table groups all of the students by class within a school, displayed by expandable rows that show the class name and how many students from that class are included in the selected cells.
- Select the row to expand the School and the Class, and you’ll see all of the info you usually see in a Reading History Overview report.
Take a look at the Class Reading History Overview report to learn how the rest of the Report works.
Error Analysis
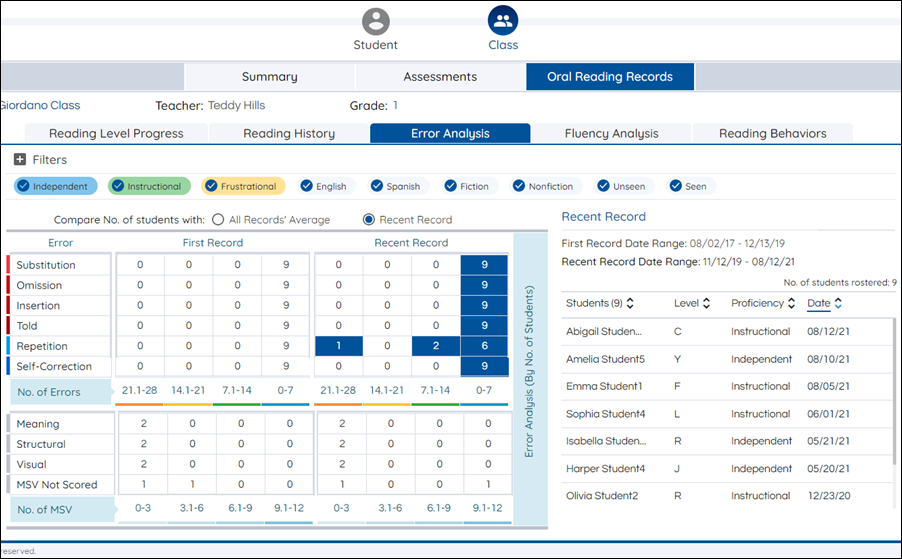
This report is available at the School level. Select a cell to see a full list of which students made a reading behavior error or an MSV (Meaning, Structural, or Visual) error the specified number of times. The student list appears in the table to the right.
This report is very similar to the Class Error Analysis Report, with only some minor differences:
- Rather than pie graphs, this report has a Student Table. The Student Table groups all of the students by class, displayed by expandable rows that show the class name and how many students from that class are included in the selected cells.
- Select the row to expand the Class, and you’ll see the student name, student grade, the level, and the student’s proficiency score. Select the row again to collapse the class.
- To change the grade, select a different grade from the dropdown in the top left of the chart.
Take a look at the Class Reading Level Progress Report to learn how the rest of the report works.
Fluency Analysis
View a summary of your School’s Fluency Analysis by selecting the Fluency Analysis tab on the Reports page. Ensure School is selected at the top.
Fluency Progress over Time
This report is available at the School level. It displays a summary of your School’s Fluency Progress Over Time. It shows how many students have scored at a particular Fluency level according to your rubric evaluations given on the Analysis step of an Oral Reading Record. It helps you identify Class-wide and School-wide trends in Fluency performance.
This report is very similar to the Class Fluency Progress Over Time Report, with only some minor differences:
- The table groups all of the students by class, displayed by expandable rows that show the class name and how many students from that class are included in the selected cells.
- Select the row to expand the Class, and you’ll see the student name, student grade, the level, and the student’s proficiency score. Select the row again to collapse the class.
- When there’s multiple classes, you can sort by Class/Student.
- To change the grade, select a different grade from the dropdown in the top left of the chart.
Take a look at the Class Fluency Progress Over Time Report to learn how the rest of the report works.
Words Correct per Minute over Time
This report displays your students’ Words Correct per Minute (wcpm) Progress over time. Words Correct per Minute is a measure of students’ Fluency.
This report is very similar to the Class Words Correct per Minute over Time Report, with only some minor differences:
- The columns on the X Axis shows which grade’s data is being displayed. Each grade has its own column.
- Each grade column on the X Axis is split into three percentile columns. The bubbles represent the percentage of your rostered students whose fluency rate is in the low, middle, or high percentile range for the grade in each month.
- The table groups all of the students by class, displayed by expandable rows that show the class name and how many students from that class are included in the selected cells.
- Select the row to expand the Class, and you’ll see the student name, student grade, the level, and the student’s proficiency score. Select the row again to collapse the class.
- When there’s multiple classes, you can sort by “Class/Student”.
- To change the grade, select a different grade from the dropdown in the top left of the chart.
-
Use the References page to view the Oral Reading Records fluency norms for both Spanish and English.
Take a look at the Class Words Correct per Minute over Time Report to learn how the rest of the report works:
Reading Behaviors
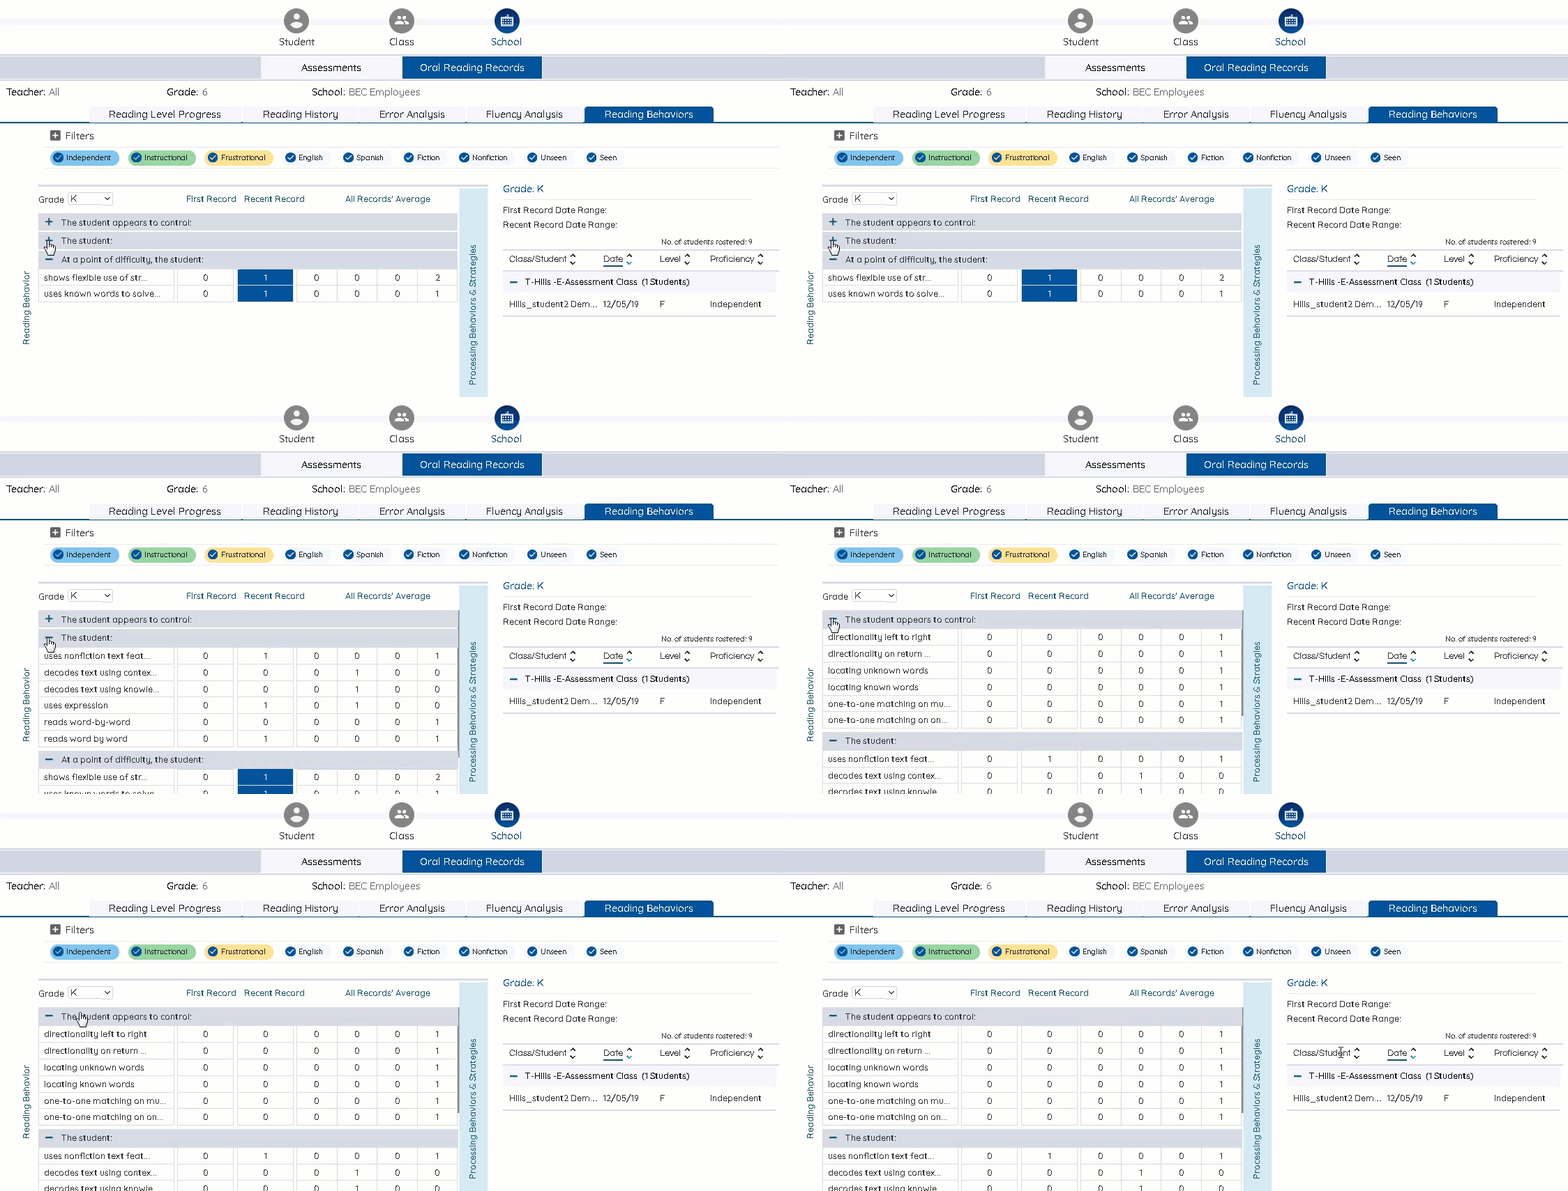
This report is available at the School level. It displays a summary of your class’ Reading Behaviors on students’ Oral Reading Records throughout the year. It helps you understand the reading techniques your students are using or neglecting while trying to read a text and identify class-wide trends.
This report is very similar to the Class Reading Behaviors Report, with only some minor differences:
- The table groups all of the students by class, displayed by expandable rows that show the class name and how many students from that class are included in the selected bubbles.
- Select the row to expand the Class, and you’ll see the student name, student grade, the level, and the student’s proficiency score. Select the row again to collapse the class.
- When there’s multiple classes, you can sort by Class/Student.
- To change the grade, select a different grade from the dropdown in the top left of the chart.
Take a look at the Class Reading Behaviors Report to learn how the rest of the Report works.
Toggle the Assessed/Not Assessed View
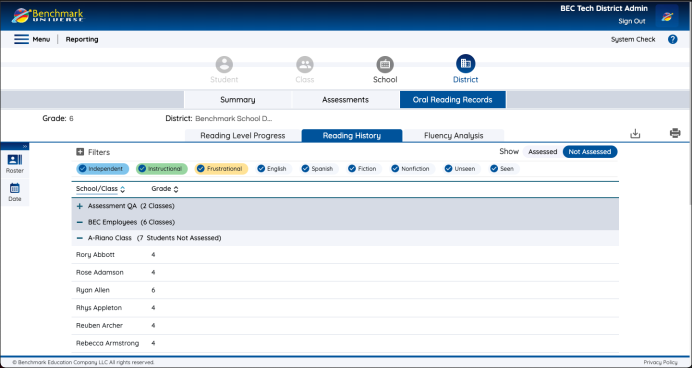
The Assessed/ Not Assessed toggle allows you to view, which students have not yet been assessed within your selected date range. This view is available at the Class, School, and District level.
